Accessibility and data visualization
Written by: Boglárka Göttli, Hanna Bekefi, István Korompai
When it comes to designing with data, accessibility is a factor that’s critical to ensuring easy and deep engagement—yet it’s often overlooked. Join us for the first article in a three-part series where we explore accessibility standards as they relate to data visualization in an enterprise context.
This post is the first in a three-part series on accessibility in dataviz.
- Accessibility and Data Visualization
A description of disabilities, techniques and standards based on existing guidelines — you're reading it right now :) - A Practical Guide for Accessibility in Business Intelligence Tools
Approaches and possibilities for applying techniques described here in Tableau and Power BI — out now in this post - Investing in DataViz Accessibility Pays Off
A plea to data leaders to invest in dataviz accessibility — spoiler: it makes total business sense — out now in this post
Accessibility refers to the design and development of digital products and websites that are easy to use and understand for people with disabilities. This includes people with visual, auditory, physical and cognitive disabilities.
Ultimately, there are three key reasons why you should adhere to accessibility standards:
- It helps to ensure that people with disabilities have equal opportunities to engage in web-based activities and services.
- Designing for accessibility leads to better usability for everyone.
- Accessibility is becoming the standard for the web, so it’s simply more efficient to start incorporating accessibility features as a best practice early rather than trying to retrofit them.
This blog post series provides technical guidance and standards on data visualization accessibility covering the web, Tableau, Power BI and future trends and standards. It explores the main trends and standards to expect in data visualization accessibility, offering actionable insights for designers.
This post discusses the different disabilities and barriers and how they affect information comprehension. It also provides guidance on designing data visualizations that are easy to understand for all audiences regardless of their abilities.
Disabilities & Barriers
According to the latest WHO statistics from 2022, an estimated 1.3 billion people — more than 16% of the population — experience a significant disability. Disabilities can create barriers to accessing and using documents, reports, newspapers, data and data visualizations, which is a major disadvantage in today’s digitized era. This leads to inequalities in content access, denying it altogether to a group of people. By designing with disabilities in mind, you can ensure that your products are accessible by everyone.
Significant progress has been made in the pursuit of accessibility, but we are still far from providing equal opportunities for people with disabilities. In 2022, only 3% of the internet was accessible, and most content creators still lack a clear understanding of how to make their websites accessible.
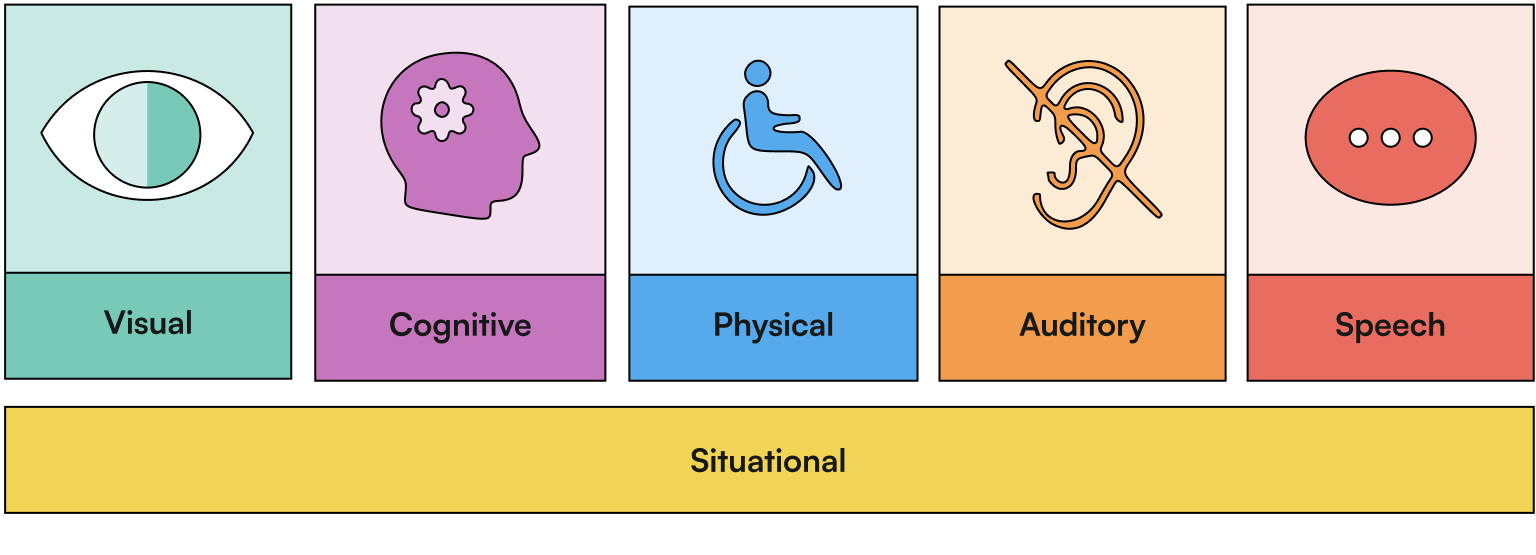
Disabilities come in many forms and manifestations and can be permanent, temporary or situational. Our attention here will be focused on those disabilities that are most relevant in data visualization, so we will not be covering speech and auditory disorders.
Designing with Data for People with Visual Impairments
Visual impairments refer to a range of conditions that affect a person's ability to see, including blindness, low vision and color blindness. People with visual impairments may have difficulty reading text or interpreting visual information and may require alternative means of accessing and interacting with charts, such as screen readers or alternative input devices. Such impairments can also be situational — imagine, for example, trying to see information on your screen in sunny conditions.
Adhering to the standards outlined below will ensure that your data visualizations are easy to understand for those with visual impairments.
Contrast
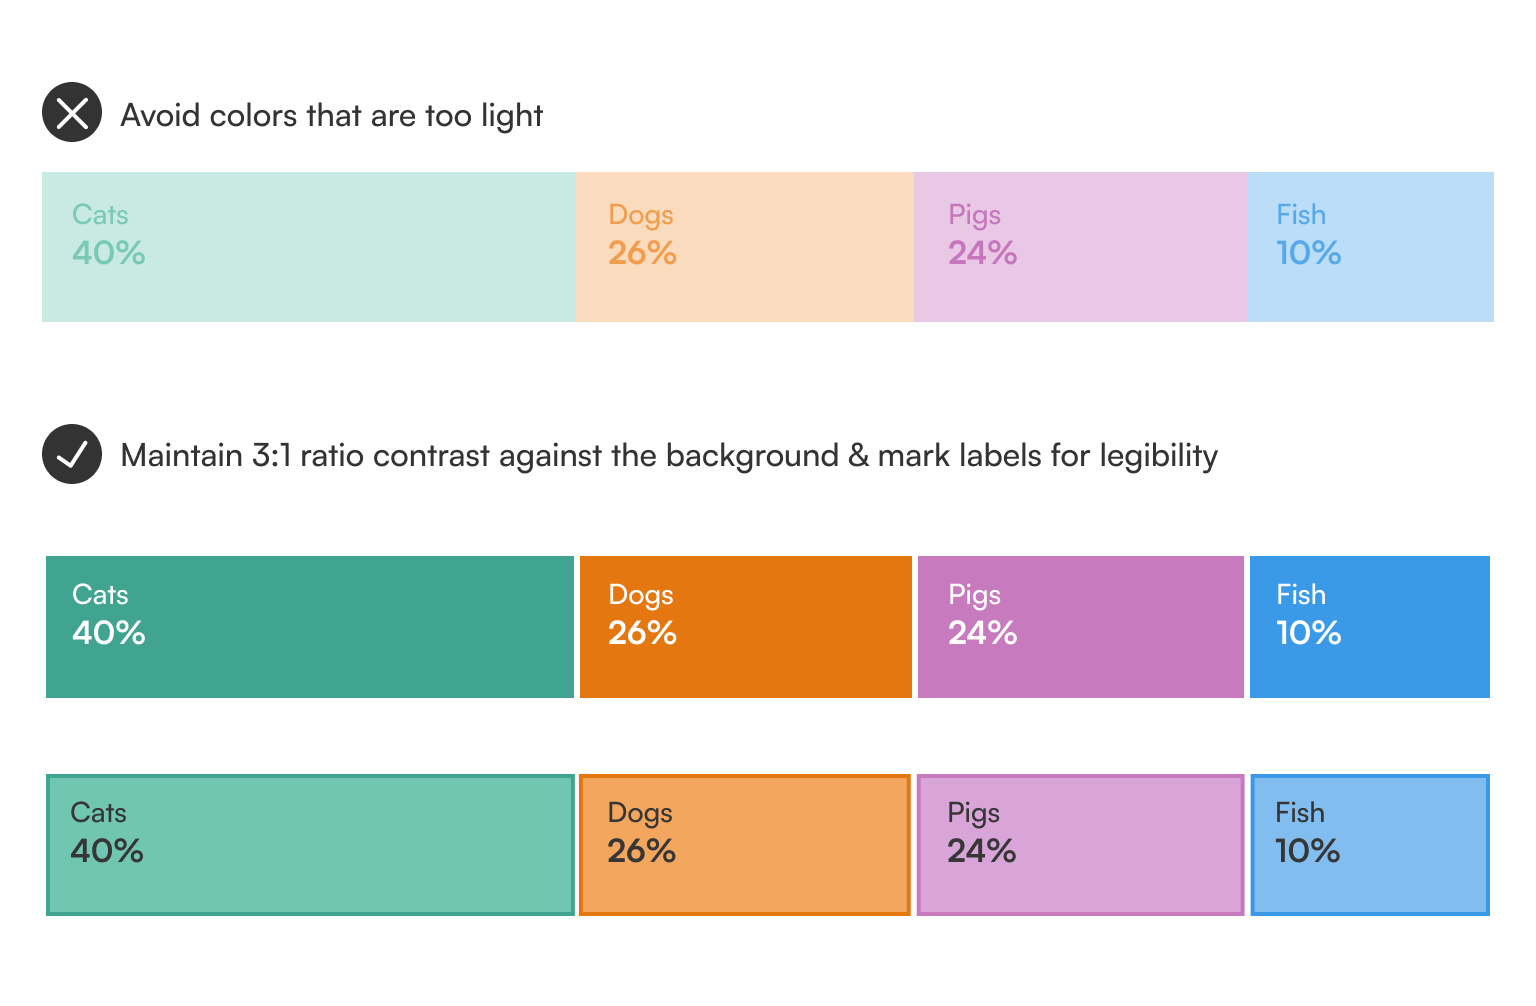
Ensure that there is enough contrast between the marks, labels and their background color. This makes reading and interpreting the information in charts easier and quicker. The most commonly used web accessibility standard, Web Content Accessibility Guidelines (WCAG), describes a method for quantifying contrast between two colors and prescribes threshold values based on this calculation. There are numerous tools to check whether your colors satisfy these — our favorite for quick checks between two colors is this one by WebAIM.
WCAG requires a contrast ratio of 4.5:1 for normal text and 3:1 for graphical objects. Adding space between the marks in your visualization can help create greater distinction between the different categories without the need for checking each discrete color against all others to ensure sufficient contrast.
Color Vision Deficiencies
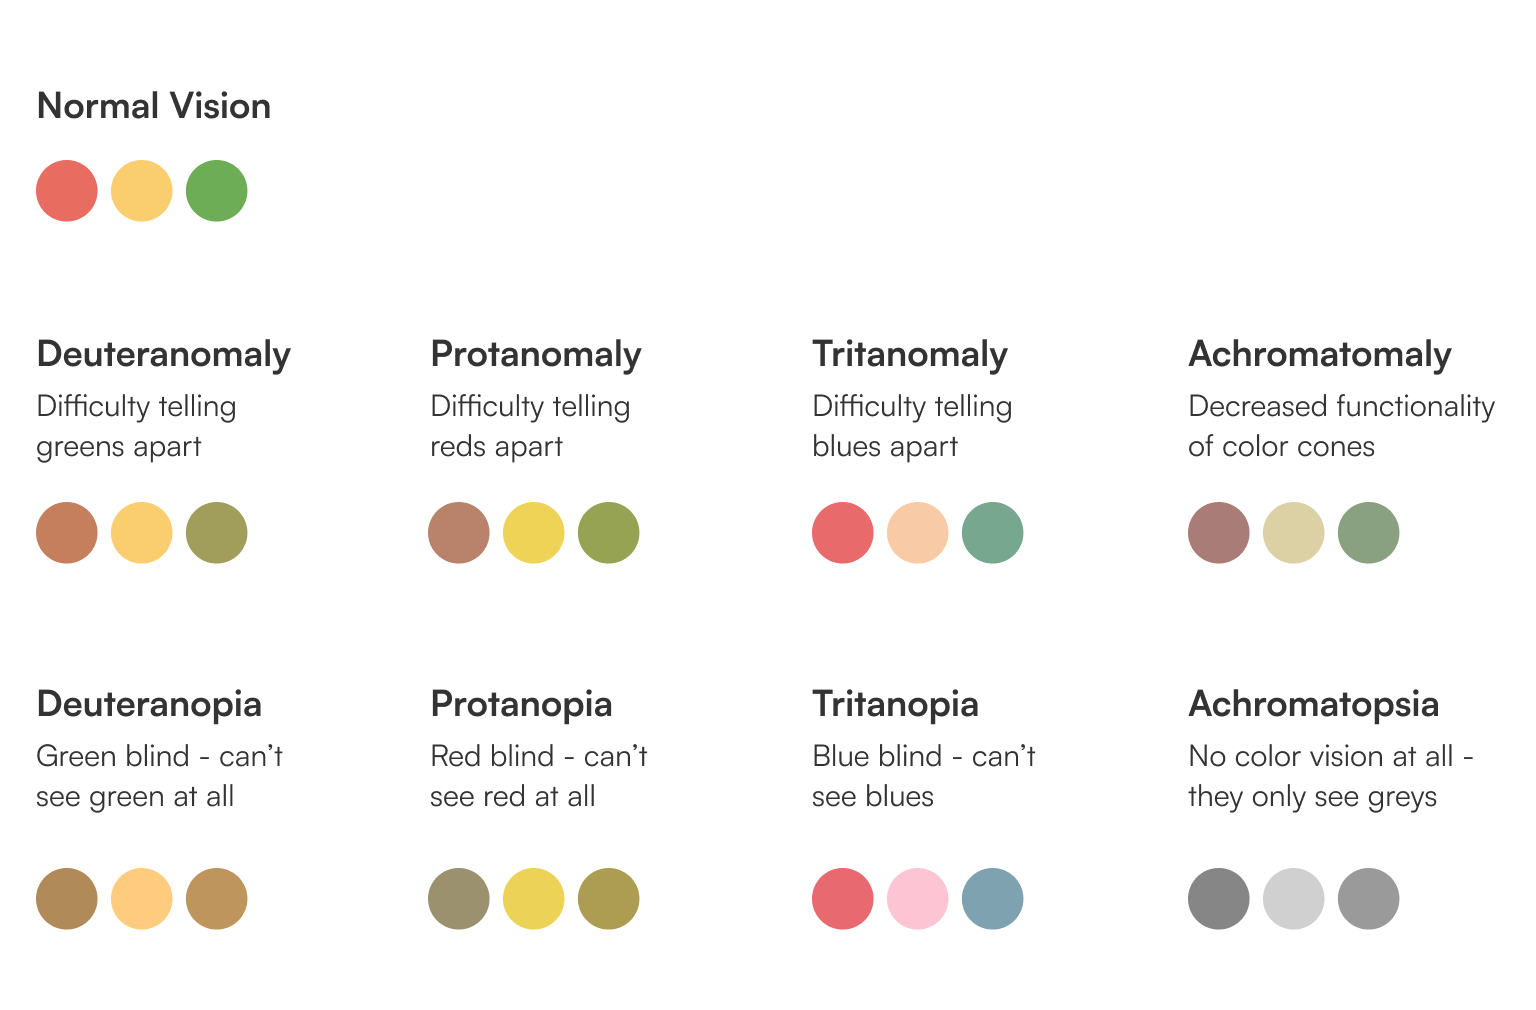
People with color vision deficiencies (CVD) are unable to perceive color the same way as those with normal vision. While we often use the term “color blindness," very few people experience a complete inability to detect hues, known as “achromatopsia.” CVDs are the single most documented and discussed topic in the field of dataviz accessibility, potentially because they are simultaneously very prevalent in the population — although mostly amongst men — and fairly easy to accommodate by choosing the right color combinations.
The diagram below provides a simulated view of how people with the most common different color vision deficiencies perceive color.
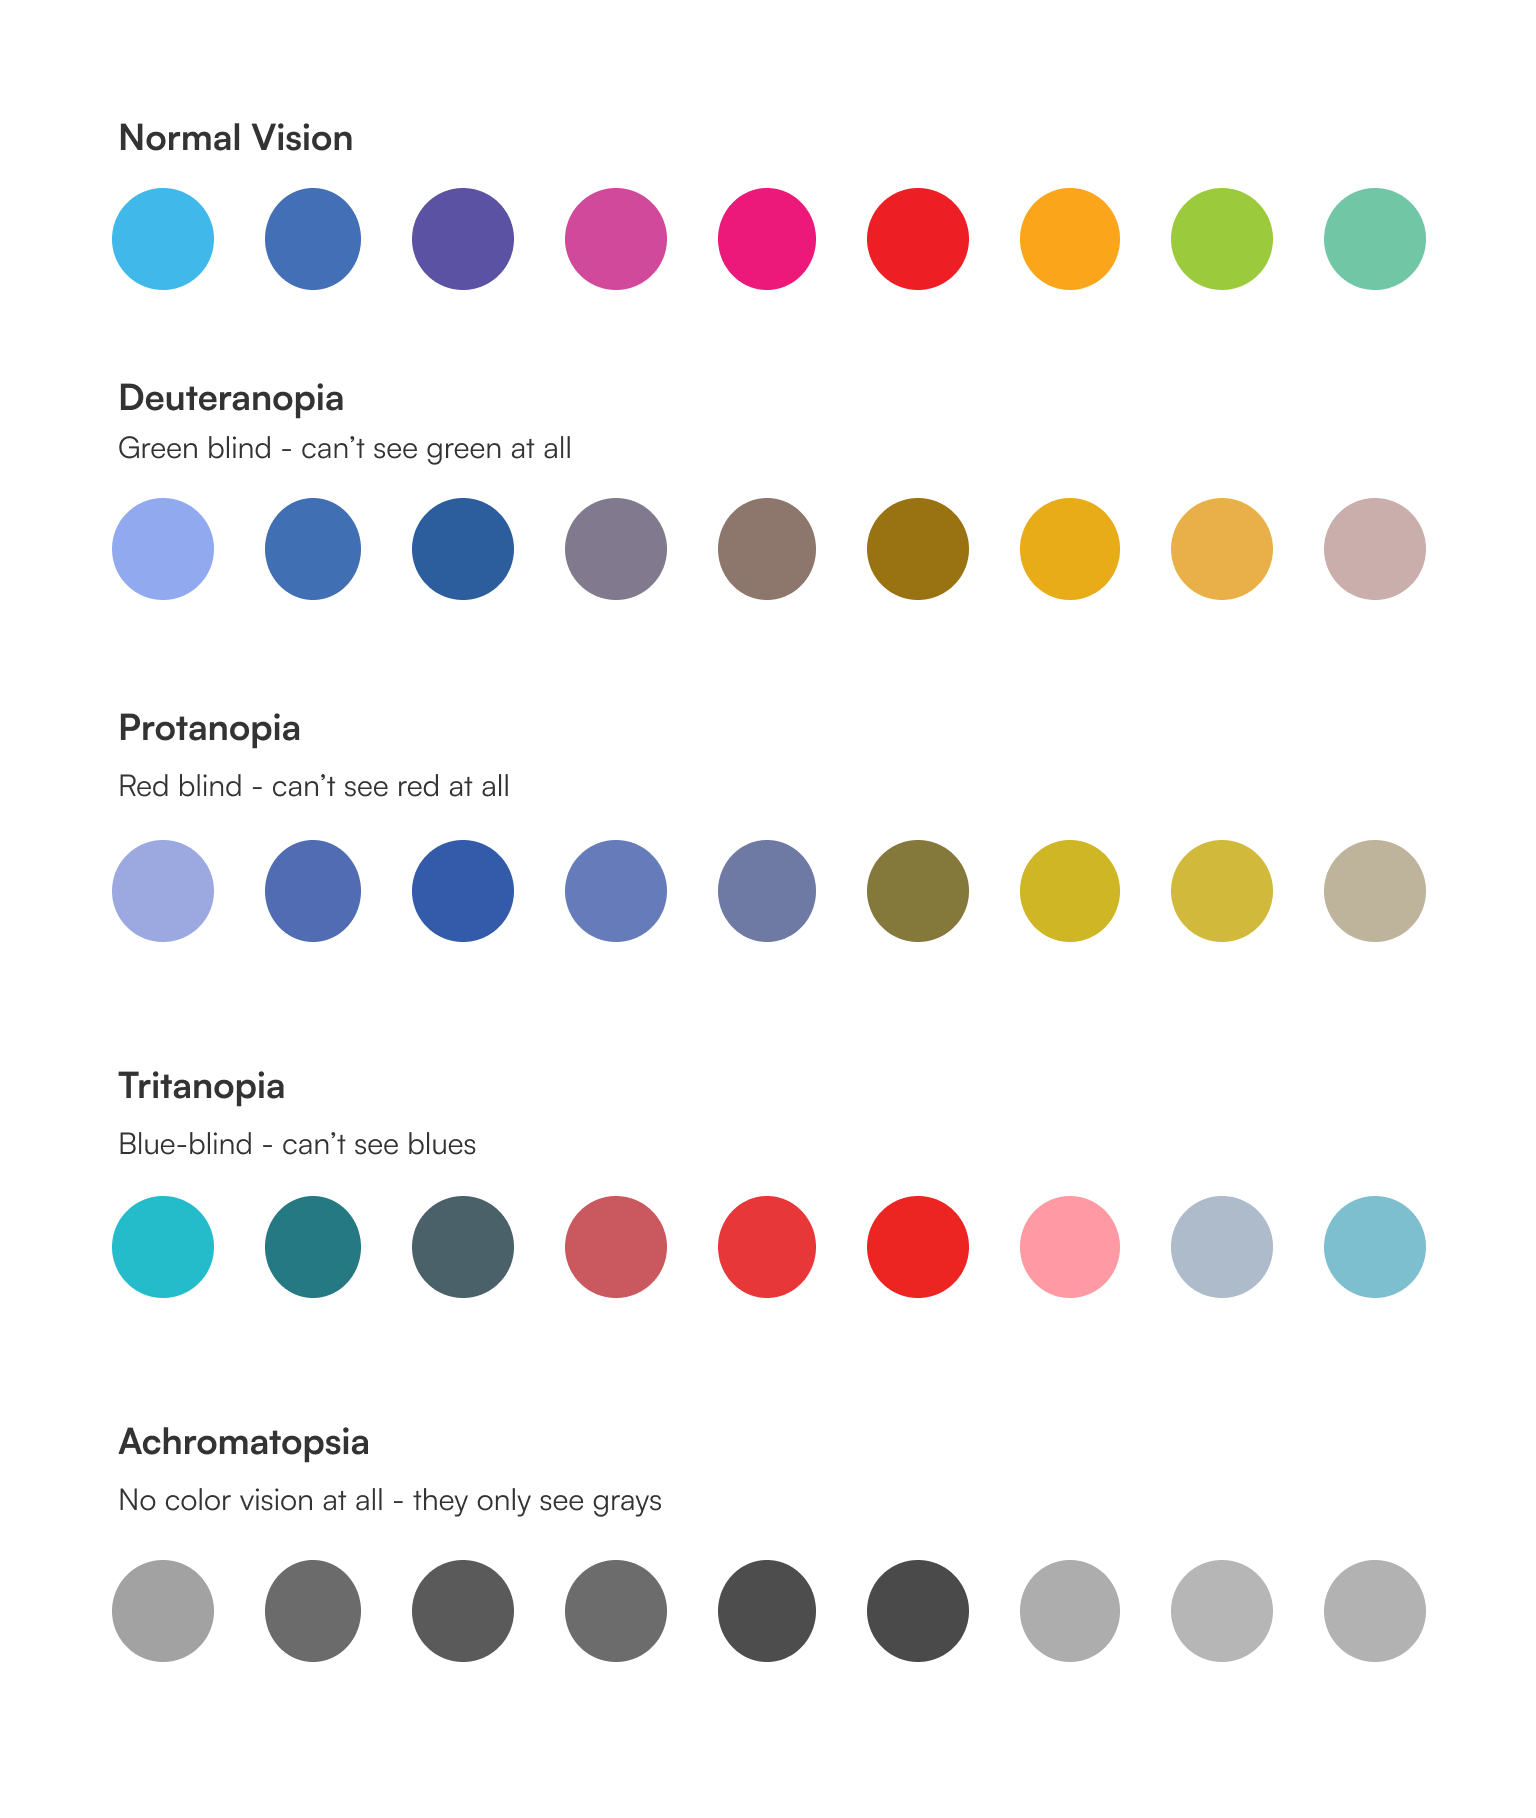
As a general rule of thumb, try to avoid the following color combinations:
- green & red
- blue & green
- blue & purple
- green & grey
- blue & grey
- green & brown
You should also rethink the traditional use of red or green alone to convey information. The diagram below illustrates how the classic traffic light approach to color to show positive and negative meaning is not accessible to those with color vision impairments and color blindness.
Instead of traffic lights, consider blue-and-red or blue-and-orange diverging scales to communicate positive and negative values and using additional cues to convey the message.
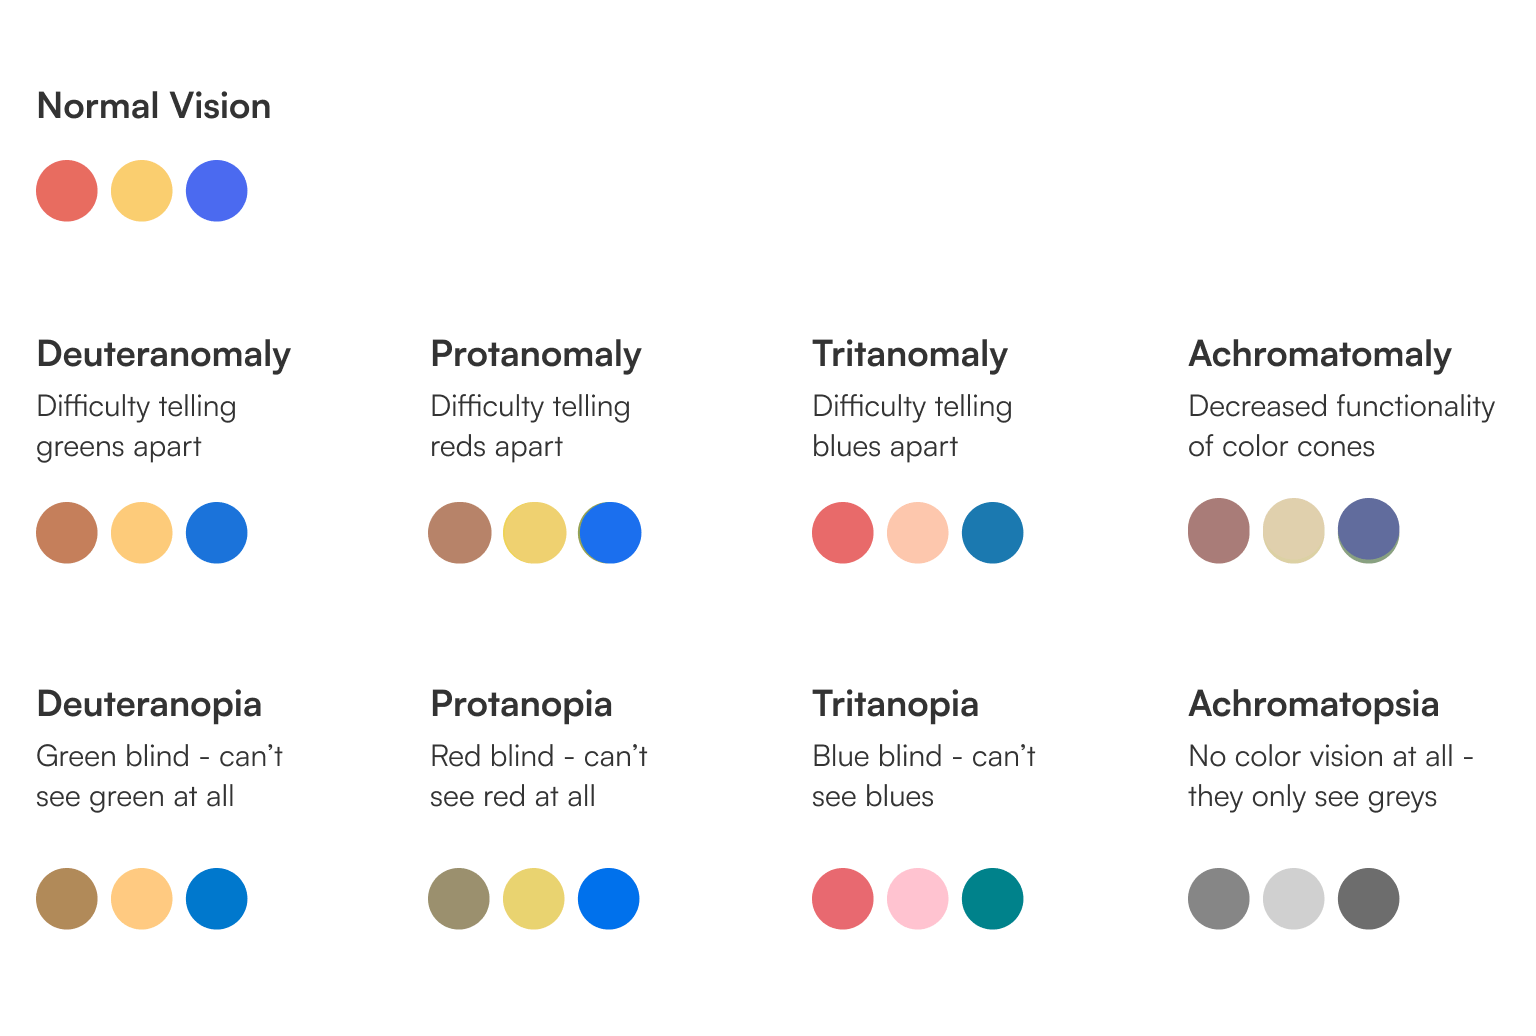
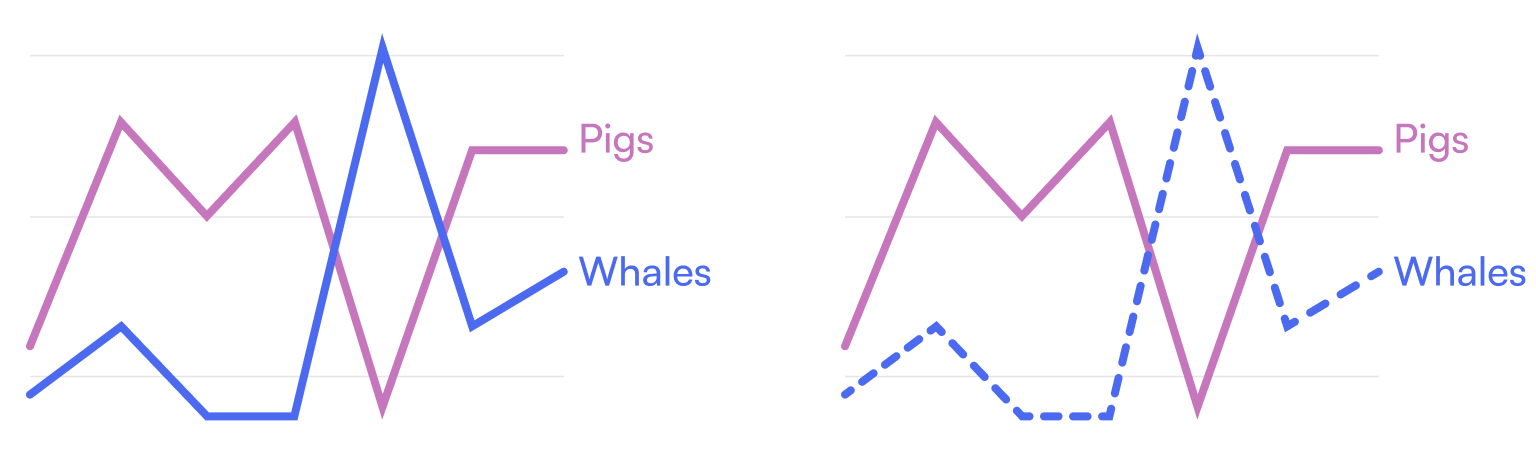
You will notice that even this is not a flawless solution for those who have no color vision at all, and that is why it’s important to use additional visual cues like shapes, size and/or supporting text to convey information. A good rule of thumb is to ask yourself if one can still read the chart and understand the meaning if color is removed.
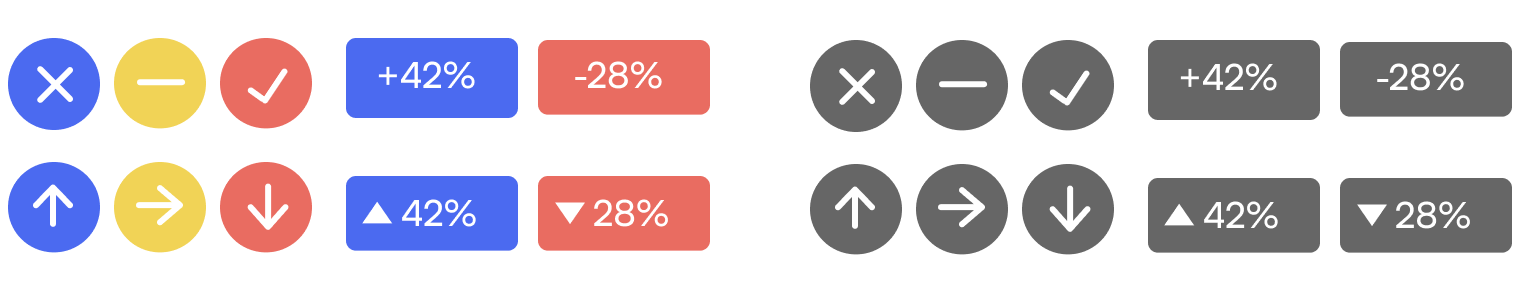
Besides adding visual cues in addition to color, a best practice is to label marks directly to help understand your charts.
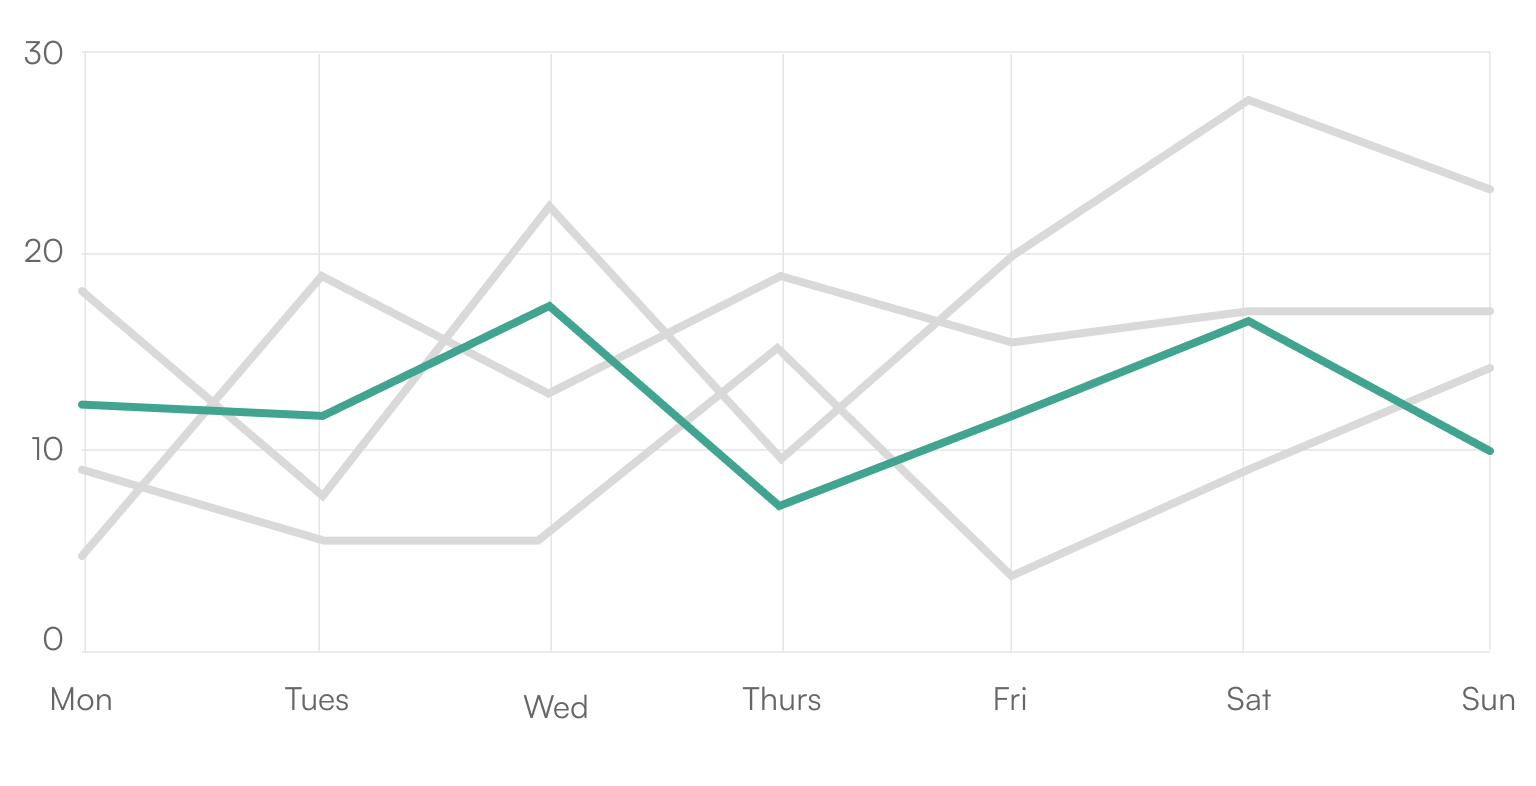
Use color to highlight important information.
This makes it easier for users to scan and find the most important information on the page. However, make sure that the highlighted color is not the only means of conveying the information.
Ensure compatibility with screen readers and other assistive technologies.
A screen reader uses a synthetic voice to describe what is happening on the screen. To ensure that all relevant information is available for the screen reader, you need to make sure that there is alt text for each element, the descriptions are clear and contain the main takeaways from the visuals, and that data tables containing individual points are included for each visual chart.
The great benefit to implementing these standards across web-based data visualizations is that it makes the graphs easier to comprehend for all audiences.
While it may be obvious that people who are visually impaired would face challenges in accessing data visualizations, this is also true for other types of disabilities.
Physical Disabilities
People with permanent physical (motor) disabilities have various degrees of limitation in movement, ranging from tremors to paralysis or missing limbs. While accessibility solutions are essential for those with permanent decreases in motor skills, people experiencing temporary limitations — e.g. due to a broken arm — can equally benefit from them.
Physical disabilities can also impact a person's ability to use digital products like data visualizations. For example, people with limited muscular control or coordination may have difficulty using a mouse or keyboard. This is why it's unfortunate that most of the internet is built around using a mouse, which limits the usefulness of many assistive technologies, as they tend to rely on good keyboard-navigability as a prerequisite.
While static data visualizations are easily accessible to people with motor disabilities, they may not be able to operate interactive visualizations, a powerful technique in contemporary data visualization.
While following the next few guidelines can provide a partial solution for people with disabilities, some are easier to implement in our current tools than others.
Alternative Input Methods
Consider alternative input methods, such as voice commands, or different input devices like trackballs, joysticks. If your interactive requires very precise mouse movements or cursor placement, these users will have a difficult time. You can alleviate some of those frustrations.
Provide full keyboard navigability, as some people with physical disabilities may not be able to use a mouse.
Make clickable buttons and elements sufficiently large.

Cognitive Disabilities
Cognitive disabilities refer to a range of conditions that affect a person's ability to process information, including learning, writing, reading disabilities, attention deficits and intellectual disabilities. While digital content with an inconsistent page structure, unpredictable and overcomplicated navigation mechanisms all decrease clarity for neurotypical audiences, it might render the content wholly inaccessible for people with cognitive disabilities, making it difficult for them to understand complex information or make decisions based on it.
This affects the comprehension of conventional visualizations as well — in particular, people who have cognitive and learning disabilities (CALD) frequently have difficulty making sense of the abstractions and symbolic conventions used in visualizations, and the aforementioned general issue with less-than-intuitive digital content applies here as well: visualizations with high information density leave those with cognitive disabilities at a major disadvantage.
Unfortunately, design recommendations for CALD-accessible visualizations are currently not informed by research and remain largely heuristic. However, when designing data visualizations for people with cognitive disabilities, there are some considerations you can keep in mind.
Be mindful of language.
Use simple language with accessible phrasing and avoid jargon or technical terms that may be difficult to understand. Avoid using too much text, as it can be overwhelming for people with cognitive disabilities.
Use a clear typographic hierarchy.
By clearly distinguishing different levels of headings and other typographic elements, users will be able to perceive the general page structure much more easily. These can be used to divide an otherwise long and difficult-to-follow piece of content into more digestable chunks.
Strive for clarity and simplicity in content and reduce visual complexity.
Use clear, concise labels and avoid using abbreviations or acronyms. Provide proper content structure by breaking down complex information into smaller, more manageable pieces.
Use visuals, such as icons or simple illustrations, to help convey information and aid people’s memory.
Skip animations when the user asks you to.
Many of the celebrated works from our field of data visualization rely heavily on animations and unexpected motions to keep readers engaged. These can trigger physiological symptoms ranging from nausea to seizures in those who suffer from dizziness, vertigo or epilepsy. Modern browsers have a setting with which one can indicate to pages that they prefer reduced motion, which all developers of data visualization should respect.
Because cognitive disabilities range across a wide spectrum, each problem may require a unique solution and approach. If you’re looking to take a deeper dive into this topic, we highly recommend an article written by designer William Careri about designing for neurodivergent audiences. In addition, there’s research available on Understanding Data Accessibility for People with Intellectual and Developmental Disabilities.
Standards and Guidelines
Fortunately, there are initiatives to make digital products accessible. Several standards and guidelines are now available to promote accessibility in design as well, but most of these either do not cover data visualization very thoroughly or are extensions of some of the ones we mention here.
Let's see a few of the most influential and useful standards and guidelines.
WCAG
The Web Content Accessibility Guidelines (WCAG) are a set of international guidelines and standards for improving the accessibility of digital content, including websites. WCAG was developed through the W3C process in cooperation with individuals and organizations around the world with the purpose of providing a single standard for web content accessibility that meets the needs of individuals, organizations and governments everywhere.
The guidelines are organized into three levels of conformance: A, AA, and AAA. Each level includes a set of success criteria that must be met in order to achieve that level of conformance.
High-Level Intro to the Guidelines (POUR)

The WCAG guidelines cover a wide range of accessibility concerns and are organized under four principles:
- Perceivable
Ensure that end users can understand the information and components being described. This includes providing text alternatives to non-textual content, captions and other alternatives for multimedia, adaptable content that can be presented in different ways and distinguishable elements to make it easier for users is a to distinguish and understand relevant information and separate foreground from background. This includes using color, visual presentation, contrast, resized text and content on hover. - Operable
Users must be able to easily navigate and interact with the website or digital product. These guidelines stress that all functionality should be available from a keyboard without the need for a mouse, compatibility with assistive technologies like screen readers should be ensured, and clear and concise instructions should be provided for navigability. Elements known to cause seizures or physical reactions should be avoided, so handle animations and flashes with caution. - Understandable
The information presented and the operation of the interface must be easily understandable for the user. This includes providing predictable and consistent design, as well as using simple language, breaking down complex information into smaller, manageable pieces and avoiding abbreviations or unusual words that may be difficult to understand. Include input assistance to help avoid and correct mistakes. - Robust
Provide a robust digital product that’s compatible with current and future user tools. Content should be interpretable by several user agents, including assistive technologies.
Notice that, while each of these pillars correspond to one or more of the tips and guidelines we included in the first part of this article, the Robust principle is very difficult to apply in most modern data visualization tools, especially when it comes to dynamically changing interfaces such as business intelligence dashboards. In these tools, real accessibility for screen readers and other assistive technologies is, unfortunately, a somewhat new frontier.
Chartability
Chartability is a collection of principles with testable criteria collected by Frank Elavsky for ensuring that "data experiences" are inclusive and accessible. Chartability consistently refers to data visualizations as data experiences since one of the goals of the workbook is to make sure that they are accessible non-visually as well.
The seven principles of this method contain the four POUR principles from WCAG and three additional guidelines that extend from WCAG’s “Robust” element: Compromising, Assistive, Flexible (CAF).
These heuristics can be used as test cases during a data visualization "audit" to identify design failures. Currently, around 50 heuristics are listed by the community members, 14 of which are considered critical. Without going through each test item, you can get a quick insight with the following five checks on how much your work meets charitability standards.
- Visual Testing
This step includes contrast checks, text size validation, ensuring that the color is used in an accessible way and other visual checks. - Keyboard Probing
Try to navigate with a keyboard using the Tab and arrows keys only to make sure the visualization is fully keyboard-compatible. If your interactive requires very precise mouse movements or cursor placement, these users a prerequisite for most assistive technologies to work correctly. - Screen Reader Inspection
A viz can be keyboard-accessible but be a nightmare for users with low vision or no vision. Trying a screen reader to make sure that all the relevant information is read aloud is the only real way to ensure they are not excluded from the product. - Checking Cognitive Barriers
Check for basic textual descriptions of charts, look for explanations on how to read and use the dashboard so you can be sure that users will know how to interact with and navigate your viz. - Evaluating Context
Context in this sense refers to your user's technical environment and the process they are involved in when visiting your data viz. During this phase, the auditor ensures that the data experience does not overrule the user's settings around high contrast mode, custom colors etc.
We strongly suggest checking out Chartability after reading this article, as it's the single most actionable guide if you want to get started with dataviz accessibility today.
If you're looking for solutions to each of these checks and are a Tableau or Power BI user, you're in luck, as that will the topic of our next article on this blog. Follow us to make sure you don't miss it.
Do No Harm Guide
The Urban Institute is a US-based nonprofit with a great data visualization practice. Their Do No Harm Guide is a treasure trove of deep dives into specific areas of dataviz accessibility by some of the most prominent members of our community working in this space.
Microsoft Inclusive Design
Microsoft employs several outstanding experts working on accessibility, and their Inclusive Design methodology is a great starting point for building culture around inclusivity, including accessibility.
ADA
The Americans with Disabilities Act (ADA) is a federal law in the United States that prohibits discrimination against people with disabilities. Although this law compels government authorities and non-profit organizations to make their websites accessible, it does not contain any objective criteria for what that means in practice. As such, specific expectations for accessibility are usually deferred to WCAG (see above).
A Brief Note on Usability
Accessibility and usability are related yet distinct concepts. While accessibility refers to the ability of people with disabilities to access and use the product, usability measures how easy and enjoyable it is for users to effectively accomplish what they need.
Even if people with disabilities are the primary focus group for accessible design, its benefits extend to all users. Accessibility problems can arise for anyone — consider, for example, environmental obstacles such as too much sunlight or darkness making it impossible to read a mobile screen, or how incidental barriers such as sleep deprivation can impair cognition.
Our third article in this series will explore this connection further and will lay out a thorough argument for the benefits of investing in accessibility.
Back-of-the-Napkin Dataviz Accessibility Checklist for the Web
This article turned out long for good reason: we wanted to provide a thorough overview of accessibility basics for anyone hearing about the topic for the first time. To close the article, we're giving you a treat for reading all the way to the end in the form of a quick-and-dirty checklist you can use to evaluate any viz you encounter on the web in order to better understand the state of accessibility in our profession.
To summarize, an accessible chart includes
- a descriptive title that sums up the key takeaways of the chart;
- contrast above 4.5:1 for text and 3:1 for graphic elements;
- non-color visual cues on top of a color blind-friendly palette;
- clearly labeled marks and interactive elements;
- alt text and annotations for a screen reader;
- a data table where a screen reader can read every individual point.
This article was the first in a series of three posts. The next one will focus on how to best comply with the many standards and requirements described here in industry-leading Business Intelligence tools, Tableau and Power BI. Follow our socials to make sure you don’t miss it.
Find out more
about the authors
Boglárka Göttli
Bogi is strongly committed to understanding her clients' needs and transforming them into impressive and meaningful data visualizations. She is a believer in continuous learning and loves trying her hand at new things.
Hanna Bekefi
István Korompai


