Turning adventures into dataviz stories pt. 2 — Japanese Edition
Written by: Júlia Borsi

A dataviz expert’s personal way of preserving memories by transforming them into data visualization stories. Click to learn more about the latest Japanese experience and discover the meaning behind the red dots!
Rose-colored graphs
I am very fond of my holiday memories. I do a lot of what everyone does: I meticulously select the best photos from each vacation, organise them into folders, and keep multiple backups. I maintain a regular journal. But I also do something entirely different - I transform my most memorable adventures into dataviz pieces. I find data visualization an excellent method to communicate the essence of these experiences and share them with others. And I’m not the only one, check out this awesome piece by Shirley Wu!
I enjoy transforming these vacations into data visualizations, but there is more to it than just that. Through creating a viz I get to relive the best moments all over again, nurturing and enjoying those memories yet another time. It's not just me who thinks memories are important. You can ask the amalgamated and averaged voices of the entire internet! I asked ChatGPT why memories are important and found its response to be an excellent summary.
‘The act of making memories is deeply ingrained in human nature, as it enhances our emotional well-being, connects us to our past and others, fosters personal growth, and adds richness to our lives. Memories are an essential part of what it means to be human, and they contribute to the richness and depth of our individual and collective experiences.’
This post offers a Data Visualization Expert's personal perspective on preserving memories.
My winter season in Japan
I contain multitudes. I am a data visualization designer who loves to wander and explore. For me, travelling is an opportunity to learn more about myself and others, step out of my comfort zone, be spontaneous and seek new experiences.
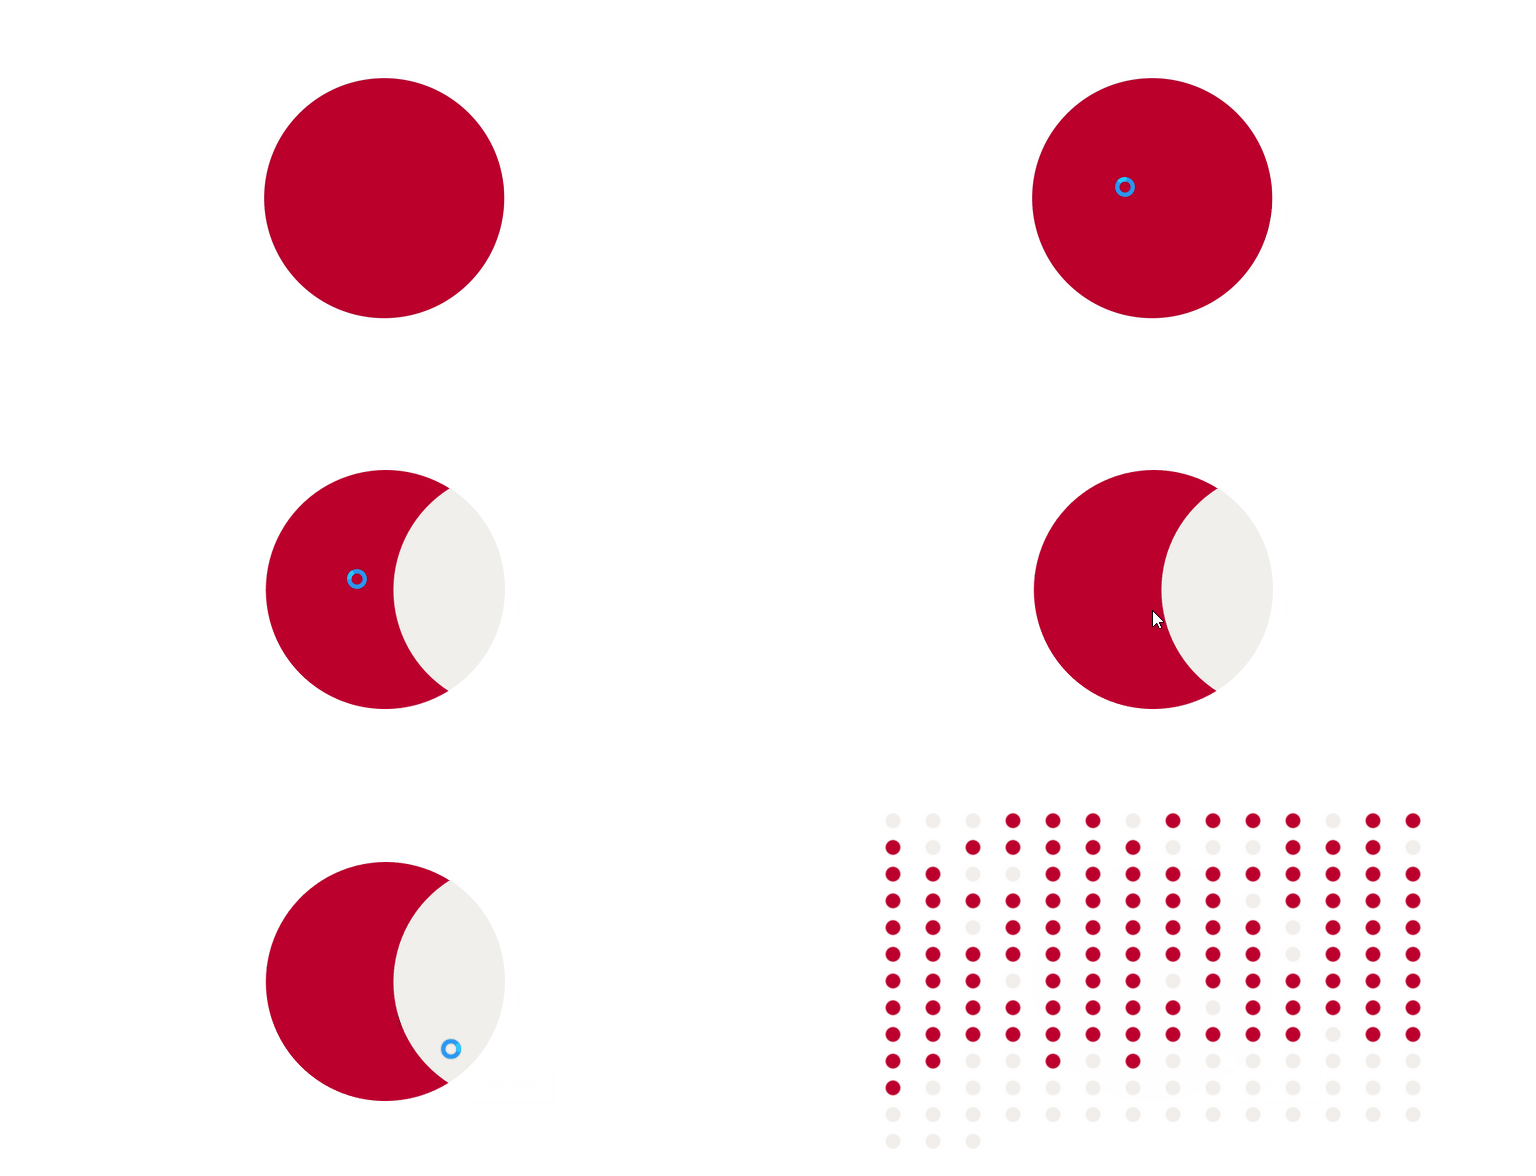
Recently, I had the amazing opportunity to spend six months in the Japanese Alps working as a snowboard instructor. When the snow season came to an end, I once again felt inspired to create a personal data visualization based on my experience. The main focus was on snowboarding, as I spent the majority of my time on the slopes.
I wanted to convey this simple message using a minimalist design, as Japanese design is also well-known for its minimalism. During my 6-month stay in Japan, I spent 65% of my days on snow, totaling 111 days. I must say, I'm quite proud of myself!
See the interactive viz on Tableau Public:
COMING SOON: If you're curious about how to create the moonpie chart used in the second visualization, don't worry! The Tableau template tutorial is on its way, produced by my wonderful colleague István Korompai!
Memories for future use
One of my favourite books is Thinking Fast and Slow by Daniel Kahneman, a world-famous psychologist and winner of the Nobel Prize in Economics. In the book, he dedicates a chapter to memories and concludes that there are two selves: the experiencing self and the remembering self. In his experiments he discovered that the experiencing self and remembering self can have different recollection of events and there’s even a conflict between the two!
He also discusses the two selves in the context of holidays - and raises some conveniently accurate questions for this blog post. “Consider the choice of a vacation. Do you prefer to enjoy a relaxing week at the familiar beach to which you went last year? Or do you hope to enrich your store of memories? Distinct industries have developed to cater to these alternatives: resorts offer restorative relaxation; tourism is about helping people construct stories and collect memories. The frenetic picture taking of many tourists suggest that storing memories is an important goal, which shapes both the plans for the vacation and the experience of it. The photographer does not view the scene as a moment to be savoured but as a future memory to be designed.”
He also believes that eliminating memories greatly diminishes the value of the experience. You can try this thought experiment to observe your attitude towards your experiencing self:
“At the end of your vacation, all pictures and videos will be destroyed. Furthermore, you will swallow a potion that will wipe out all your memories of the vacation. How would this prospect affect your vacation plans? How much would you be willing to pay for it, relative to a normally memorable vacation?”
What’s your perspective?
Try taking a moment to reflect on your relationship with memories and vacations. Consider what makes a vacation truly memorable. Which vacation do you still remember vividly, even after a significant amount of time has passed?
And finally, how do you like to remember your own vacations? Do you have your own way to preserve them? A souvenir on the shelf, a photo album on your computer, or perhaps retelling the best stories every Christmas dinner to the same audience?
Do you think about both the memories and the experience when planning a vacation? Do you have a specific way of remembering, something uniquely your own? Or perhaps do you prefer people to wave fewer phones at concerts and live in the moment a bit more?
Previous adventures and stories
I have a track record of transforming personal adventures into data visualization stories. Over the years I have discovered that learning new tools and experimenting with different charts or designs is much more enjoyable when I’m working with personal datasets. Later on, I can apply the tools and techniques I have learned to other professional projects, but starting with personal data serves as great motivation.
Visit Vincent
In 2020, I spent a few months in St. Vincent and the Grenadines, a stunning Caribbean island country. It consists of the main island of St. Vincent and 32 islands and cays known as the Grenadines. During those three months, my friends and I divided our time between the two biggest islands – St. Vincent and Bequia – and spent our weekends exploring the rest.
St. Vincent is not a well-known location, rather a hidden gem. I wanted to to showcase the numerous attractions and breathtaking locations it had to offer, using data from Tripadvisor. That's how the project got its name — I wanted to encourage others to Visit Vincent too!
Check it out on Tableau Public or read more about the creative process.
Greetings from Bali
In 2022, I had the opportunity to go on a two-month trip to Bali with some friends and colleagues. The time flew by as we rented a villa, worked remotely, and explored the beautiful island.
Despite the fact that we were working during our stay, it still felt like a vacation. This inspired me to convert my Google Locations history into a personal postcard with István Korompai, where I could highlight the places we visited on the island and share the story of our holiday.
Check out the interaction version and make sure to flip the postcard over.


