Turning adventures into dataviz stories
Written by: Júlia Borsi
How it’s made: a behind-the-scenes look at a personal viz that required way more effort than the author anticipated. From the adventure that inspired it, through cumbersome data collection and first design iterations that just didn’t work, it’s all in there!
The Adventure
The story starts at the end of 2020, at the height of COVID worldwide, when no vaccines were available yet. By pure luck, a couple friends and I found out that the small Caribbean island country of St. Vincent and the Grenadines had zero COVID cases and was letting visitors in with strict entry requirements. What seemed like a crazy idea at first eventually turned into a plan, and we decided to make the country our temporary home for three months.
Those few months were some of the most magical times of my life. The country is made up of the main island of St. Vincent and 32 islands and cays – the Grenadines. We divided our time between the two biggest islands – St. Vincent and Bequia – and spent our weekends exploring the rest. I was taken with the beauty of the place, the kindness of the locals, and the number of attractions it had to offer.
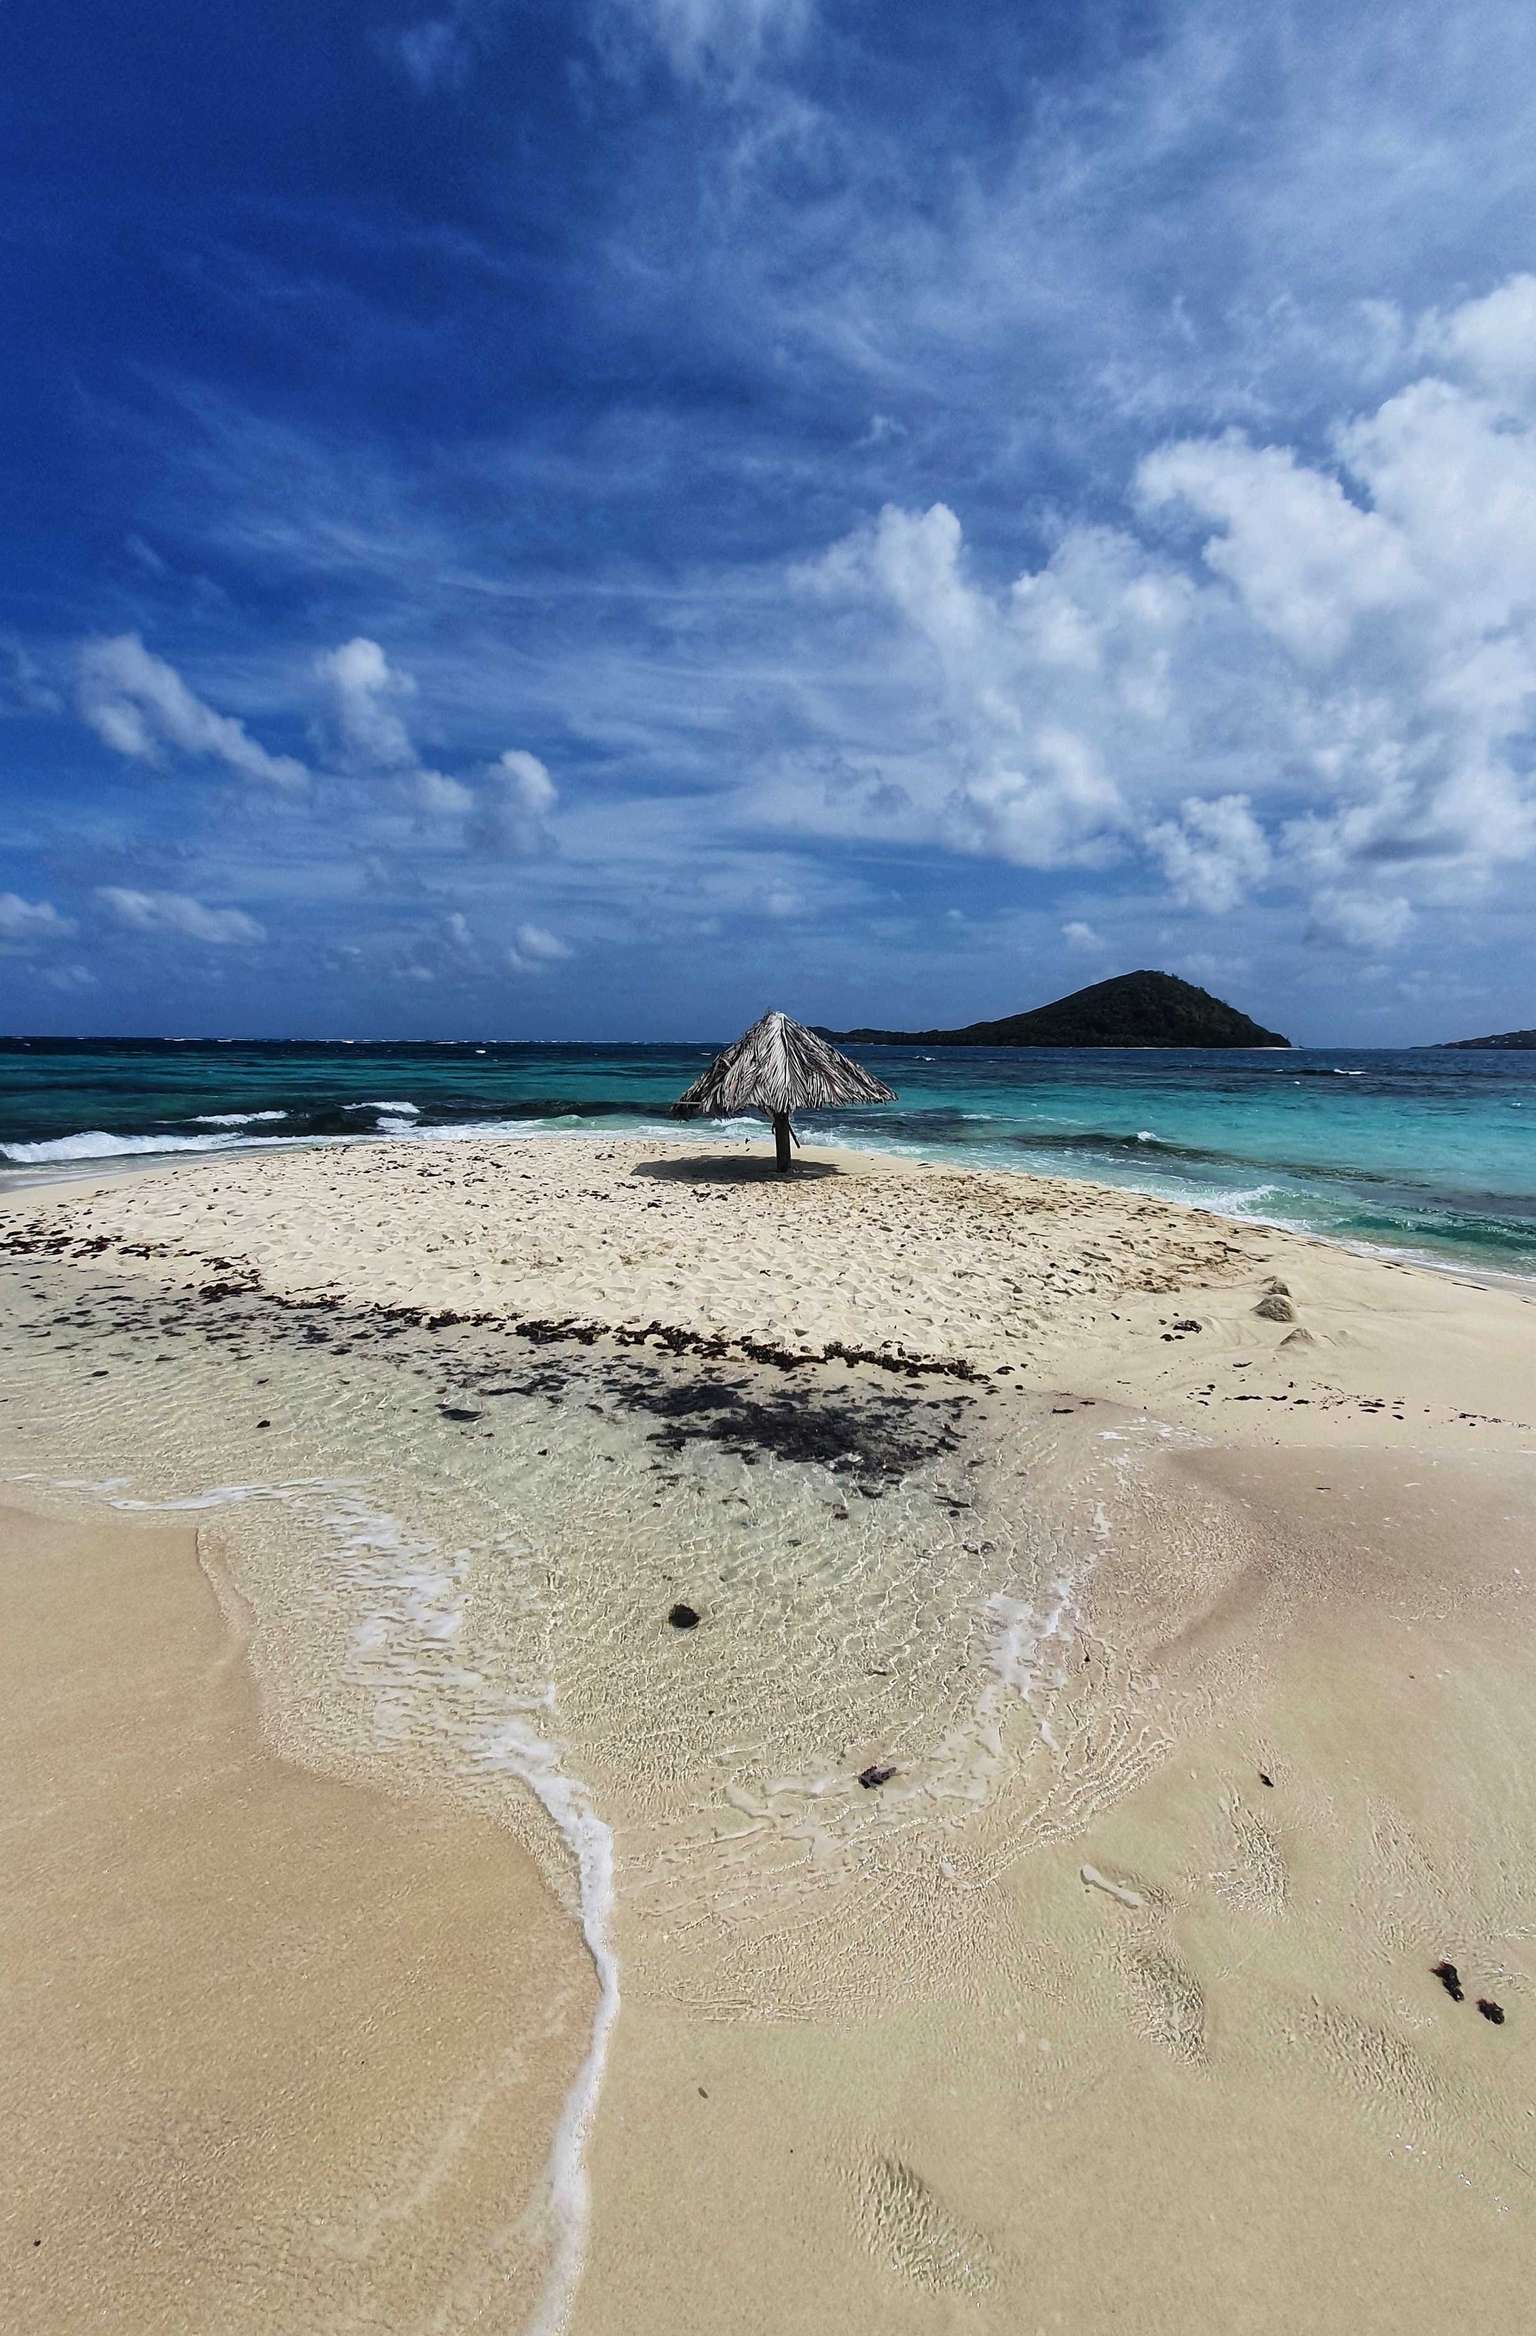
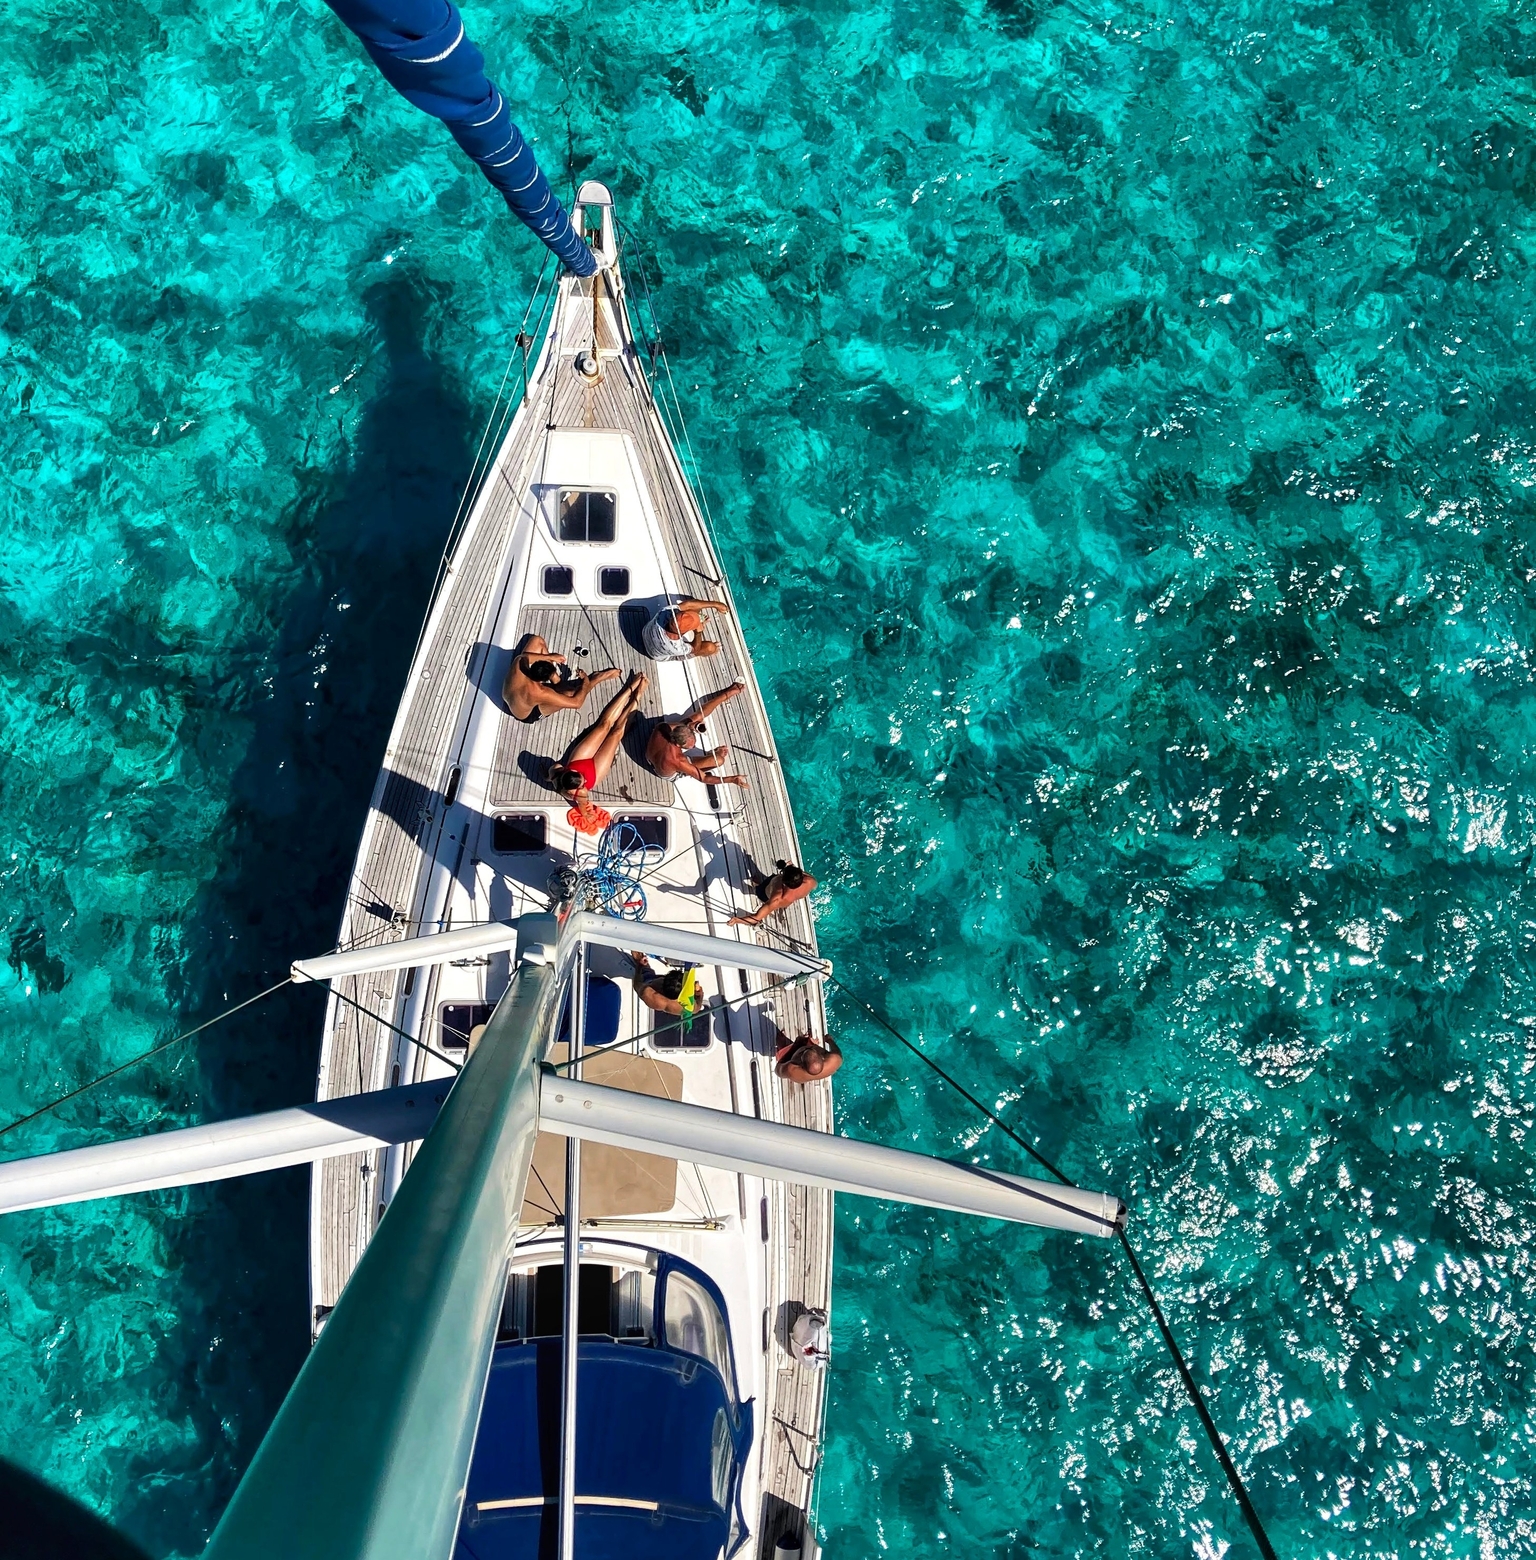
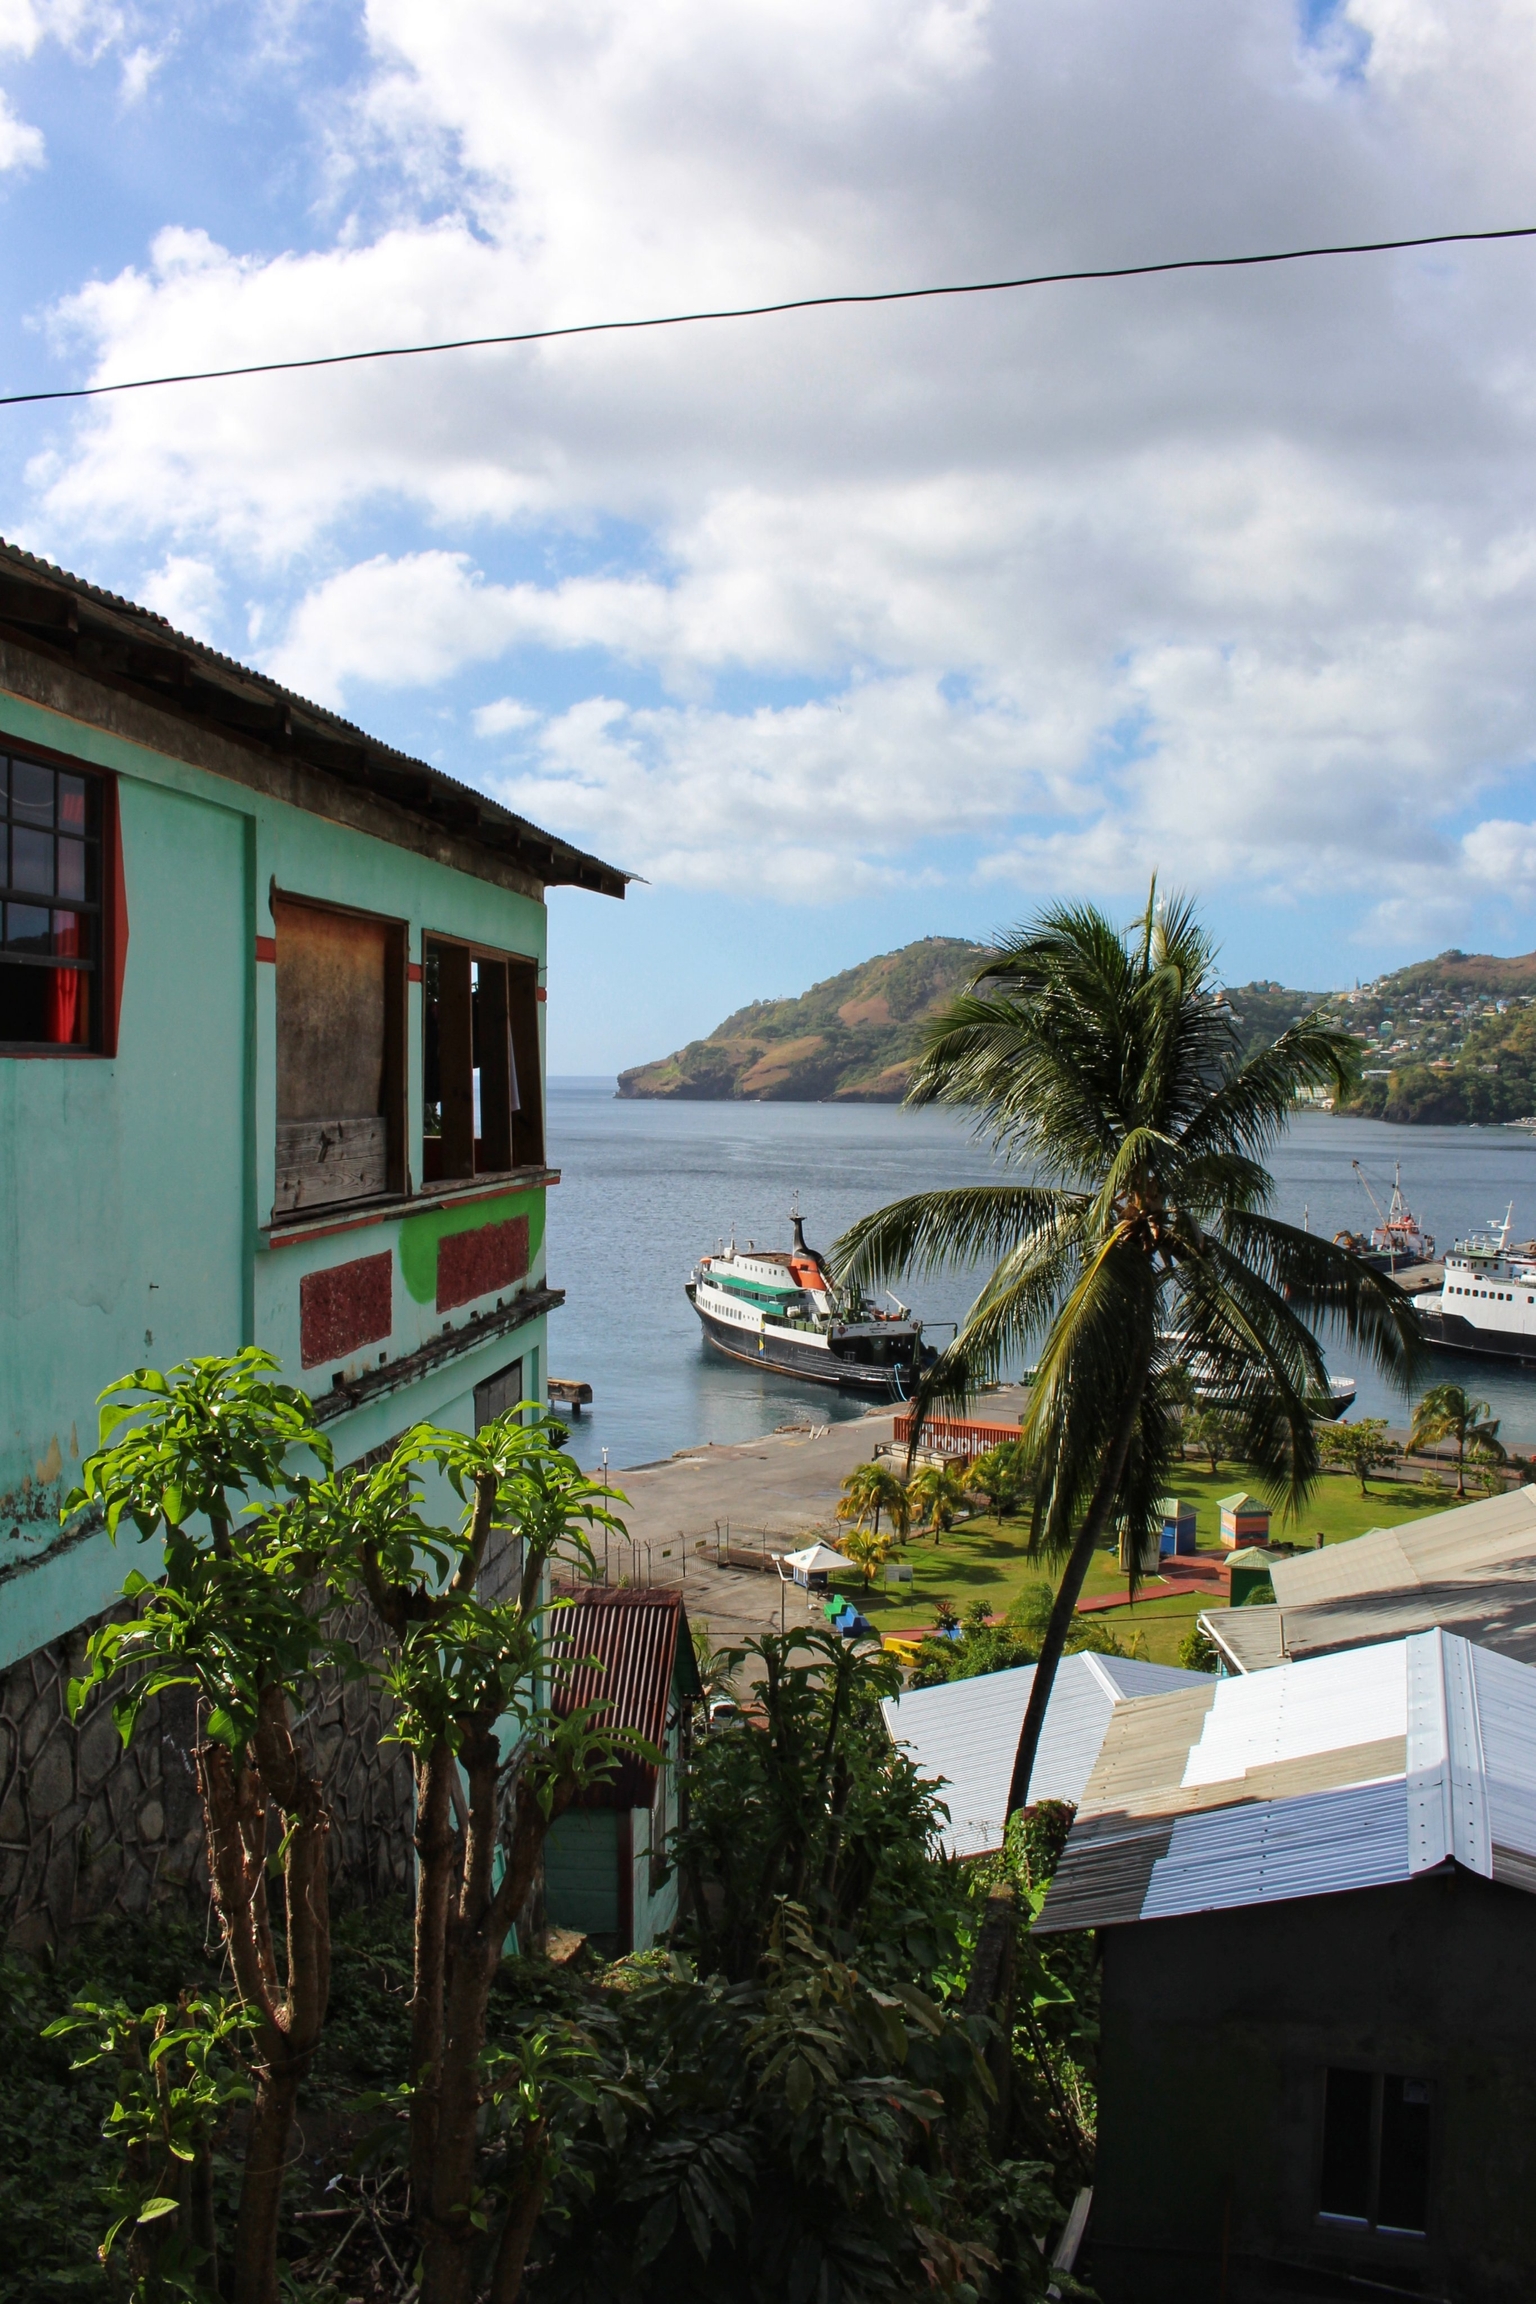
I was having the time of my life, and these pictures don’t even do the place justice:
I kept wanting to share my experiences so that others might also be inspired to Visit Vincent – and the idea for a viz was born.
The Data
I knew I wanted to use Tripadvisor’s data from the very beginning, as it has been our main source of information for planning adventures – besides tips from the locals. However, getting the actual dataset turned out to be a lot harder than I anticipated, as Tripadvisor doesn’t offer a convenient way to access the information I needed.
I quickly got familiar with the idea of web scraping, which involves ”various methods used to collect information from across the Internet” and is generally “done with software that simulates human web surfing to collect specified bits of information from different websites.”
A few beginner’s Udemy Python courses later, I was able to start bugging my co-workers and little brother with endless questions. I used the Selenium web driver, which enables you to automate browsers. I also found a public GitHub repo that already achieved something similar.
The information I needed was a bit more detailed than what I was able to get my hands on with these tools, but it was enough to get started. My ultimate goal was to have a list of all attractions, their type and exact location.
The Scraping Process
- Tripadvisor hashes and obfuscates the pages' source – I needed to spend hours just to locate the things I needed. Also, they disallow basically any programmatic scraping, so I had to pretend to be a human clicking with the necessary speed.
- All four categories - restaurants, things to do, hotels, and vacation rentals - had slightly different logic and naming conventions, so I had to handle each and every case and detail separately.
- For places where there was no Tripadvisor latitude/longitude attribute (scraped from the center point of the attached Google Maps mini-map widget), I ran the location’s name through the Google Maps API.
- Places with no location data were excluded from the dataset. Luckily, there weren’t that many of these.
- An especially funny little detail: Tripadvisor likes to pretend that there are more things than you can look up even in smaller places. At one point, my code went into an infinite loop through the four pages of hotels – Tripadvisor was trying to deceive me on how many there actually were!
Writing the actual code was a long process mostly because of the many detours I took. Some of them were the result of my then-poor Python knowledge, while other times Tripadvisor was simply doing its best to make my life miserable. Fast forward to a few months later, and I finally had the dataset ready.
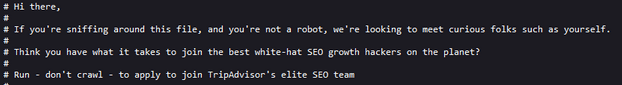
Apparently, Tripadvisor likes people clever enough to try and scrape them, at least enough to employ them – here's a little screenshot of their robots.txt file that tells crawlers what they can and cannot access.
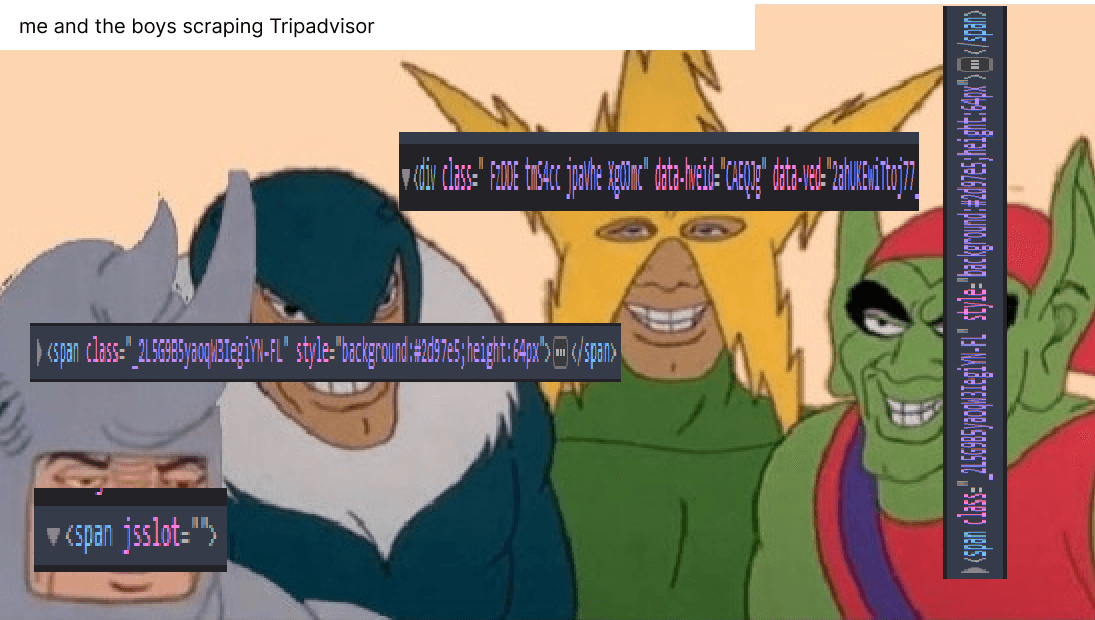
Meme created by my brother about the whole scraping process. We were clearly losing our minds at this point.
The Design
As with any design, this one went through a few iterations before reaching its final form. After jumping through all the hoops to scrape the location of the attractions, I knew I wanted to show them on a map somehow. Below is my first attempt:
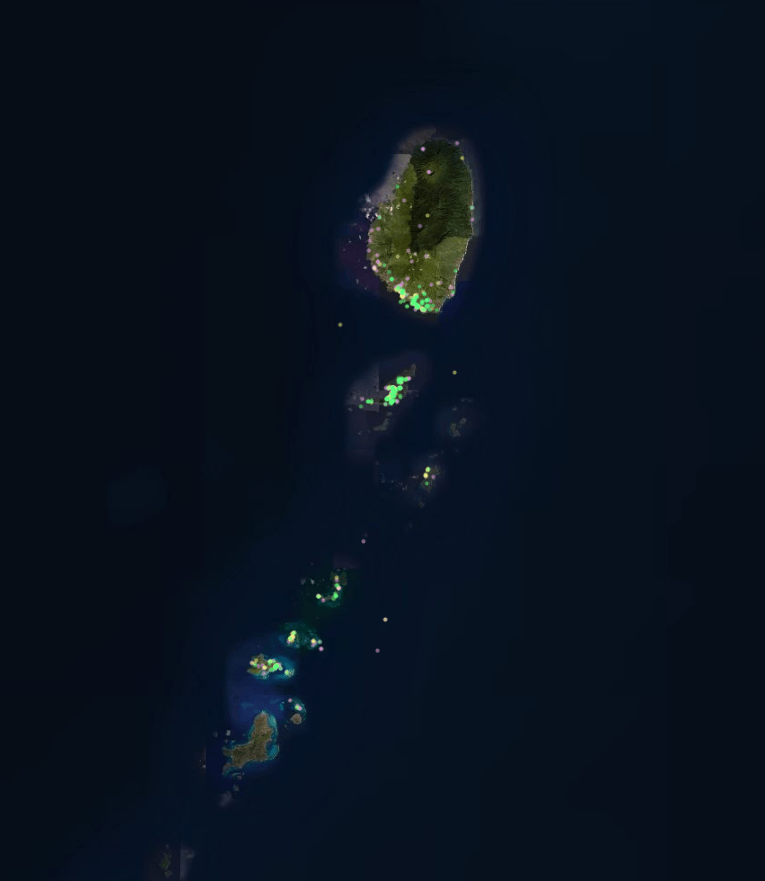
I was dissatisfied with this design, as it was not showing the density of the attractions, and the patterns I wanted to highlight were not clear. Luckily, I bumped into @ShijaWendy’s blog post, and after a few trials and errors, I produced my own version:
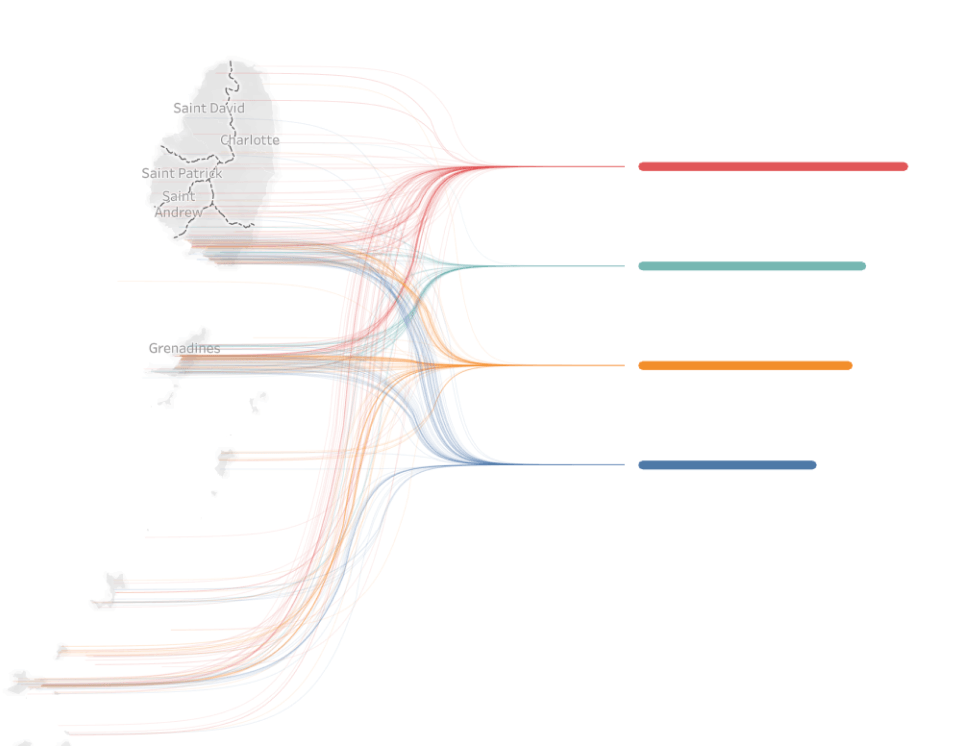
The visual was getting my message across: that this small country has a ton of attractions to offer to visitors. It’s also visible that the small Grenadines islands have more places for tourists to visit, while the main island is less busy in this regard.
All I had left was to create the poster-like design I had in mind in Figma, with annotations, explanations and an extra chart that categorizes attraction types. The background map was created by remixing Mapbox’s Outdoors template and colors were generated with Coolors.
So, without further ado, here’s the final visualization!
Takeaways
This project is really close to my heart, and I’m glad I poured all this effort into finishing it. Learning new tools and experimenting with different charts or designs is much more fun when the dataset is personal. In the end, I walked away with basic Python and web scraping knowledge because I was so determined to gather the necessary information.
Throughout the process, I would ask for help frequently, so a huge shoutout to my brother and my good friend and colleague Pisti for spending hours with me learning Python and my team lead Tomi for his feedback during the design process.
I hope this project will inspire you to put St. Vincent and the Grenadines on your bucket list. It’s a true hidden gem that I feel more travelers should know about.
Bonus Fun Facts
What makes St. Vincent and the Grenadines so special? Here are a few things I learned about the country during my time there.
- The official name is Saint Vincent and the Grenadines, but the Caribs, or the early inhabitants, would call it “Hairoun,” meaning the “Land of the Blessed.”
- The country’s signature drink – Sunset Very Strong Rum – is so strong (84.5%) that it’s illegal to export it. Locals say it doesn’t give you a hangover but I can testify that it most certainly does.
- If some places seem familiar to you, it might be because the first The Pirates of the Caribbean movie, The Curse of the Black Pearl, was shot there. We re-watched it during our two-week quarantine upon arrival.
- There is an active volcano on the main island called La Soufrière. It last erupted in 2021, just a few months after our departure, after laying dormant for 42 years.
- Bequia is the largest island in the Grenadines, with an area of only around seven square miles, and is home to around five thousand people. It was also our home for a few months.
- Other smaller islands in the Grenadines are frequently visited by the rich and famous, and some of them are privately owned by a consortium of landowners. Mustique is usually referred to as The Millionaire Island, while Canouan has earned the name The Billionaire Island.
- Mopion is the smallest of all the islands, a tiny, pure-sand piece of land in the Grenadines, with just a single thatch umbrella in the middle. It’s considered by many to be a sort of geographical mascot for the whole area.