Employee turnover dashboard for your HR department
Written by: Ivett Kovács
In our new series of blog posts, we will tackle reporting and dashboarding challenges in different business functions through examples, starting with an HR report in Tableau, more specifically employee fluctuation (turnover).
A quick note: This post was originally published some time ago on DataViz.Love, our old blog. We have moved it here for preservation with the approval of the author(s).
What is employee turnover and why do I need an employee turnover dashboard anyway?
“The ratio of the number of employees that leave a company through attrition, dismissal, or resignation during a period to the number of employees on payroll during the same period.” - businessdictionary Employee mobility is at its peak now and will continue to grow in the future as more and more jobs becoming mobile-enabled. Employers and HR departments have to understand how it affects their organization to successfully overcame its challenges. As Edward E. Lawler III wrote in a Forbes article: “Depending upon the complexity of a job and the level of management, the cost of turnover can equal anywhere from one month’s to several years’ salary for a departing employee. The more complex the job and the higher level of the job, the greater the cost.” By analyzing employee turnover, organizations can understand its pace, effects and root causes so they can take actions.
Behind the scenes: why we needed an Employee Turnover Dashboard?
This example dashboard started as an internal project for our beloved HR department because they wanted more insights into employee turnover so they can plan our growth more accurately. As a Tableau enthusiast team our first idea was to create an HR Dashboard in Tableau for them, so they can use it and evolve it as their needs changing. Halfway through the implementation we decided to create an HR Dashboard example out of it and share it with the Tableau community.
Requirements for our HR Dashboard
Our HR Director wanted to see all employee turnover related information on aggregated level and in detail on one dashboard, to be able to instantly know where we are compared to our plans, pick up trends and identify root causes. More specifically she wanted to identify which group is in danger of leaving the company and why.
Employee Turnover Dashboard Implementation
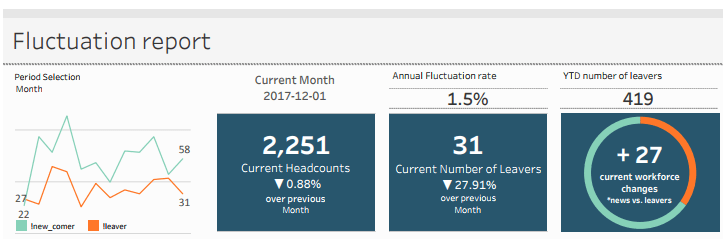
After analyzing the requirements, we agreed to put the “big picture” on the top section of our dashboard. This allows HR and top management to see the aggregated and current numbers in an instant and then dive into potential causes below.
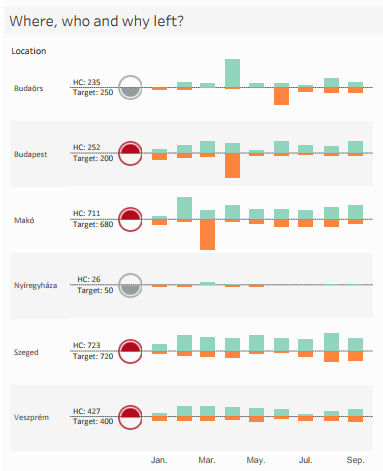
On the left side below the aggregated level, we broke down turnover numbers to departments (and added location in the example as an other dimension that could be relevant to other companies). This way are able to tell which department has to pay more attention to keep our awesome colleagues engaged and satisfied.
On the right side we wanted to investigate generational differences and how long we can keep our people, so we can plan better career paths.
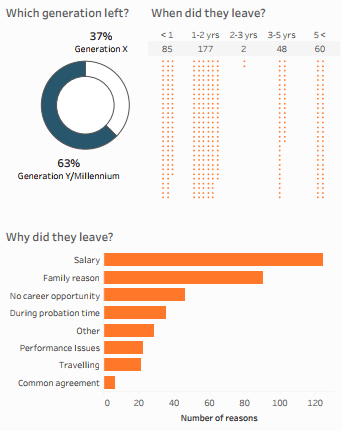
Last but not least, we also channeled back the reasons for leaving from exit interviews conducted by HR.
What's happening within the company?
Outcome
By adding employee turnover and cost-to-hire into the planning we can now calculate with pretty accurate costs to maintain a certain position. We also identified which team needs to ramp up their efforts in keeping members and started to take actions. You can analyze the full report here: Fluctuation report
Got questions?
Feel free to ask: hello@tableausoftware.hu @IvettAlexa


